I’ve developed a solution to the idea posed the other day. It wasn’t hard, but here’s an official write-up of the effort for what it’s worth.
Who did what now?
Apparently first showing its face as part of Eric Allman’s sendmail, syslog is available from the ubiquitous logger(1) UNIX/Linux command to the Log4j Java library and everywhere in-between. Syslog provides simplistic fire-and-forget UDP[1] messages with a timestamp.
We’ve had a centralized syslog setup for a good 13 years now. Why not use syslog over UDP to deliver metrics due to its nearly zero barrier to entry for developers, systems, and sysadmins?
We’ve been very passively using Ganglia for what amounts to our largely “get something going” metric gathering effort. Having heard about Graphite (technically the home is here but… ew) many times now and having played with it briefly a few months ago, I decided to see what all the hubbub was about.
After about 2 hours of fussing around and reading[2], I had Graphite up and functioning and… there it was. Oh, right. I have to somehow feed it data.
There’s this StatsD thing I keep hearing in the same breath as Graphite. Turns out it is for (drum roll) allowing special UDP fire-and-forget metric packets to be sent to it where the daemon aggregates data before sending calculated statistics off to Graphite’s carbon backend. We don’t have a use for that right now and it’s yet another thing to run and maintain, so I’m passing it over for the time-being.
Right. I like using, when possible, what is widely available instead of distributing new package or library dependencies to all nodes in our infrastructure. And so, the goal is: Figure out how to get arbitrary metrics (zero configuration per new metric desired) sent to a central location via syslog and get graphs.
Enter Logster
It became clear from the generous replies to my request for comments that, at least for this proof of concept effort, Logster was going to play a role.
Logster is typically instantiated via cron with command-line options indicating a “parser” to use and a log file to watch. It determines (via its logtail dependency) what was last seen in the log file from the previous cron run, and feeds all new lines through the specified parser. The parser (essentially a custom plugin you write in Python) is responsible for returning instances of MetricObject. If you’re curious about the parsers right now, have a look at one of the samples from the source: parsers/SampleLogster.py
syslogmaster% sudo yum install -y logcheck
syslogmaster% cd /tmp
syslogmaster% sudo wget -q --no-check-certificate -O logster.tar.gz https://github.com/etsy/logster/tarball/master
syslogmaster% sudo tar xzf logster.tar.gz
syslogmaster% cd logster*
syslogmaster% vi logster # look around for crap to change and change it
syslogmaster% make install
syslogmaster% cd parsers && echo "Now write a parser..."
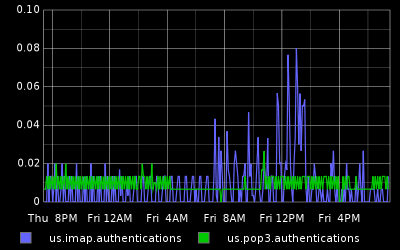
On our syslog master where this was installed, I cut my teeth on a simple parser for our Cyrus IMAP server, copied it to /usr/share/logster where it could be picked up properly, and made a per-minute cron job:
0-59 * * * * /usr/sbin/logster -o graphite --graphite-host=rcf-metrics:2003 CyrusIMAPSyslog /speaker/log/auth.log
Rad. A graph. I think this server is a little underutilized:

The MetricLogster Parser
Since I had Logster successfully feeding working data into Graphite’s mouth, I set out to the real task at hand and crafted my “MetricLogster” parser, which can be found in my fork of the Logster repo on github (etsy/logster pull request 12 has been filed).
Interlude: Syslog snag!
If you syslog frequently enough, you get the dreaded last message repeated N times lines in your log file and not actual data. I worked around this by switching our syslog master server from RHEL 5’s syslogd to a hand-build of rsyslog (which comes as default in RHEL 6). The rsyslog package has a $RepeatedMsgReduction global directive which one can set to off to always log data and never log those annoying messages.
Back to The MetricLogster Parser
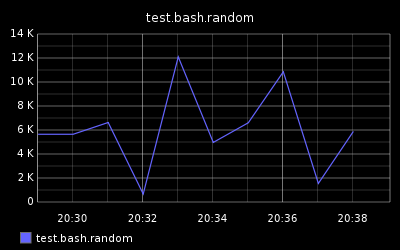
Let’s test this thing out.
Generate syslog data with random numbers from bash’s builtin $RANDOM:
client% while :; do \
logger -t whatever -p local1.info metric=test.bash.random value=$RANDOM; \
sleep 2; \
done
On the syslog master server, instead of waiting for cron every minute (since we’re testing), run Logster every 3 seconds and feed our metric data into Graphite/carbon:
syslogmaster% while :; do \
sudo /usr/sbin/logster -o graphite --graphite-host=rcf-metrics:2003 \
                       MetricLogster /speaker/log/local1.log ; \
sleep 3; \
done
Generates this kooky but successful graph:

Notes and Ideas
- rsyslog supports input and output modules. If there was an output module for
rsyslogthat wrote directly to Graphite (technically carbon-cache or carbon-relay), we could remove Logster, itslogcheckdependency (forlogtail) and the custom Logster parser module (MetricLogster) from the the whole picture. - If StatsD accepted well-formed basic syslog data, that would be slick too.
- I have no idea how well Logster scales.
- The keys in the metric syslog lines could really be shortened to
mandv(frommetricandvalue) to save a 10 bytes per log line. - I am an infant in this arena.
- My statistics knowledge is 1/100th what it needs to be.
- There needs to be a Graphite and Friends resource hub/wiki
- Sure, this isn’t a gigantic achievement of mine, but words here are free and I’d be remiss to not say: Thanks to the Etsy and Orbitz engineers who have made Logster and Graphite freely available, the rsyslog developers, all of the generous people who offered comments to my previous post on this topic, and all of the noisy people I follow on Twitter who share info and/or provide me with ideas or answers weekly.
Footnotes
- Unless TCP is specifically configured as the transport where supported. Use whatever suits your needs – the information above still applies.
- If the graphite-dev team at Launchpad would be so kind as to let me join the club, I would happily submit patches to a lot of things I found wrong, even if I do have to learn stupid Bazaar. It’s been a week now or so since my request to join. Do you guys want help or not? ;)
Great job!
hey man, cool post. two things:
1. You said you didn’t want to have to install another package, but …you installed another script? Don’t see much difference.
2. You can submit “pull requests” to graphite without joining graphite-dev. In bazaar it works a bit differently – you just branch the repo and open a ticket requesting a merge.
great post. I’ll be employing this strategy to gather request/response time from apache proxy logs.
thanks a ton
Scott, I said  “I like using, when possible, what is widely available instead of distributing new package or library dependencies to all nodes in our infrastructure.”
Where did I install a new script on all of our nodes?
Thanks for the bzr info.
Oof! I mistakenly attributed Graphite to Etsy in the original version of this post.
Orbitz developed Graphite and released it, not Etsy.
I have updated the post.
That is a really interesting implementation and could prove very useful for people who already have syslog punching through firewalls.Â
We’ve been using logster and Graphite for around nine months now and over the weekend I had a similar idea to you, which I’ve implemented independently. I’m kicking myself for not thinking of it sooner as I’ve been frustrated by having to show a number of people how to write Python parsers :)
Anyway, I’m keen to contribute what I’ve done back to the project, but I wanted to bounce it off you first. I’ve done something similar to allow arbitrary counter metrics to be incremented, but also (in the same vein as StatsD) to allow times/durations to be recorded. The difference with the durations is that the median and 90th percentile are calculated and pushed into Graphite rather than the total. I’ve written a stats helper to calculate these as I didn’t want to introduce a dependency on an external Python package (and it’s not my first language).
My intended producer of these logs is Log4J like logs, so the syntax of my log statements has differed. I’m not sure how attached to your syntax you are. What I’m coming to is: should I contribute to your parser or create a whole new one?
Hey Mark, by all means feel free to work with MetricLogster. I am not attached to my particular syntax at all and will gladly adapt to any changes you make there.
Excellent idea, Jeff!
syslog-ng (which I’ve previously detested, but I think I have to revise my opion of) can output to arbitrary UDP ports. Coupled with output templates and a bit of filtering, may actually be able to do away with Logster, at least as far as moving data to Graphite is concerned.
The environment I’m currently working in uses syslog-ng so I might even try this shortly.