Sometimes (rarely), I get what I consider to be a clever idea.
Today, while tying up an evaluation of Zenoss Core it occurred to me that one could get nice system performance graphs by simply syslogging the performance data to Splunk, which provides for time series-based graphing.
Monitoring agent, schmonitoring schmagent. We’ve got syslog, cron, and bash/perl/python/ruby on the system already, and we’re syslogging to Splunk already.
The selling feature here is that you can turn any metric’s data into a chart, and that data can be anything you can gather from a UNIX shell (in our case, spawned by cron).
As a proof of concept, I spent 5 minutes and whipped up the following test script which runs out of cron repeatedly (choose your own interval).
#!/bin/sh

VMSTAT=`vmstat 1 2 | tail -1 | awk '{print "runqueue=" $1 " scanrate=" $12 " blockedprocs=" $2}'`
LOAD1=`uptime | sed 's/.*load average: \(.*\), .*, .*/load1=\1/g'`
logger -t stats -p user.info $VMSTAT $LOAD1
This syslogs a line like the following one at the chosen cron interval:
Dec 1 00:24:19 ourhost stats: [ID 702911 user.info] runqueue=1 scanrate=0 blockedprocs=0 load1=0.78
Now, since you’re syslogging all of your host data to Splunk (you are, right?), it’s just a matter of graphing the data against the event’s timestamp in Splunk.
Our Splunk 4.1.6 search query was as follows for our proof of concept data:
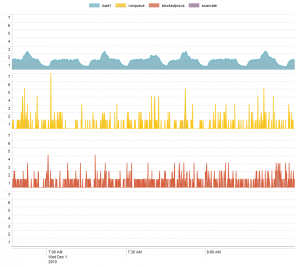
"ourhost stats:" | multikv | table _time load1 runqueue blockedprocs scanrate
Clicking “Show Report”, setting Chart Type to “Area”, Multi-Series Mode to “Split”, and Null Values to “Treat as zero”, we get the following:
We’d love to hear your comments. Jeff Blaine with Splunk search brainstorming assistance from Jeremy Maziarz

Oooh, this is nice! Excellent tip! Thanks.
My only issue with this is that, generally speaking, if you need to take down the search indexer which this syslogs to, or you have a network dropout etc, then the syslogging will be lost in transit as it’s a udp service? As opposed to if you use the splunk forward agent, which would instead cache the logging until the service returns?
Darren,
Splunk is not receiving syslog data directly. It’s indexing the growing syslog data on disk, written by syslogd. Bringing down Splunk does not drop or lose anything, but bringing down syslogd on the master syslog server host would.
As for network drop-outs, well, I guess you’re right in that you could gain data caching by using a Splunk Forwarder, but there’s the cost of doing that as well.
This solution isn’t really suited to an extreme environment where 1-5 seconds of performance data (from a network dropout) is unacceptable. By the same token, neither is SNMP and likely many others.
Actually, I suppose SNMP would be fine in network dropout, depending on timeout settings.
Hi,
This post inspired me to do a Splunk add-on for performance metrics. I used the open source library SIGAR and its python bindings to send metrics to Splunk. See the add-on here – http://splunkbase.splunk.com/apps/All/4.x/Add-On/app:SIGAR+Performance+Metrics+Add-on+for+Splunk
Github repo coming soon.
Cool, John